Saturday, 8 February 2014


Displaying Data in a 3DChart with ASP.NET Web Pages using the Chart helper.
Creating a 3DChart from Data
The data you display in a chart can be from an array, from the results returned from a database, or from data that's in an XML file.you can do it using aspx pages/Razor/cshtml pages.

Chart Elements
Charts show data and additional elements like legends, axes, series, and so on. The following picture shows many of the chart elements that you can customize when you use the
Chart helper. This article shows you how to set some (not all) of these elements.Chart Healper
The
Chart helper can render more than 30 types of charts, including all the types of charts that you might be familiar with from Microsoft Excel or other tools — area charts, bar charts, column charts, line charts, and pie charts, along with more specialized charts like stock charts.
Step 1:
using System;
using System.Collections.Generic;
using System.Linq;
using System.Web;
using System.Web.UI;
using System.Web.UI.WebControls;
using System.IO;
using System.Web.Helpers;
step 2:
Then you need to create the chart using the below code --C#.
protected void Page_Load(object sender, EventArgs e)
{
List<ChartData> objcountry = new List<ChartData>();
objcountry = GetCountryList();
var myChart = new Chart(width: 300, height: 300, theme: myTheme).AddLegend().SetXAxis("months").SetYAxis("Resource")
.AddTitle("Resource Utilization in Projects in Week 1", name: "shauraj").AddSeries(name: "Resource Utilization in Projects in Week 1", //markerStep: 1, xField: "reeee",
xValue: objcountry.Select(x => x.months).ToArray(), //new[] { "Peter", "Andrew", "Julie", "Mary", "Dave" },
yValues: objcountry.Select(x => x.count).ToArray() //new[] { "2", "6", "4", "5", "3" } Guid.NewGuid().ToString("N")
);
myChart.Save(Server.MapPath("~/Scripts/Column.png"), "PNG");
Image1.ImageUrl = "~/Scripts/Column.png";
var pie = new Chart(width: 300, height: 300, theme: myTheme).AddLegend().SetXAxis("months").SetYAxis("Resource")
.AddTitle("Resource Utilization in Projects in Week 1").AddSeries(name: "cpecial Like", chartType: "pie",//markerStep: 1, xField: "reeee",
xValue: objcountry.Select(x => x.months).ToArray(), //new[] { "Peter", "Andrew", "Julie", "Mary", "Dave" },
yValues: objcountry.Select(x => x.count).ToArray() //new[] { "2", "6", "4", "5", "3" }
);
pie.Save(Server.MapPath("~/Scripts/pie.png"), "PNG");
Image2.ImageUrl = "~/Scripts/pie.png";
var Area = new Chart(width: 300, height: 300, theme: myTheme).AddLegend().SetXAxis("months").SetYAxis("Resource")
.AddTitle("Resource Utilization in Projects in Week 1").AddSeries(name: "cpecial Like", chartType: "Area",//markerStep: 1, xField: "reeee",
xValue: objcountry.Select(x => x.months).ToArray(), //new[] { "Peter", "Andrew", "Julie", "Mary", "Dave" },
yValues: objcountry.Select(x => x.count).ToArray() //new[] { "2", "6", "4", "5", "3" }
);
Area.Save(Server.MapPath("~/Scripts/Area.png"), "PNG");
Image3.ImageUrl = "~/Scripts/Area.png";
var Bar = new Chart(width: 300, height: 300, theme: myTheme).AddLegend().SetXAxis("months").SetYAxis("Resource")
.AddTitle("Resource Utilization in Projects in Week 1").AddSeries(name: "cpecial Like", chartType: "Bar",//markerStep: 1, xField: "reeee",
xValue: objcountry.Select(x => x.months).ToArray(), //new[] { "Peter", "Andrew", "Julie", "Mary", "Dave" },
yValues: objcountry.Select(x => x.count).ToArray() //new[] { "2", "6", "4", "5", "3" }
);
Bar.Save(Server.MapPath("~/Scripts/Bar.png"), "PNG");
Image4.ImageUrl = "~/Scripts/Bar.png";
var Line = new Chart(width: 300, height: 300, theme: myTheme).AddLegend().SetXAxis("months").SetYAxis("Resource")
.AddTitle("Resource Utilization in Projects in Week 1").AddSeries(name: "cpecial Like", chartType: "Line", markerStep: 2, // xField: "reeee",
xValue: objcountry.Select(x => x.months).ToArray(), //new[] { "Peter", "Andrew", "Julie", "Mary", "Dave" },
yValues: objcountry.Select(x => x.count).ToArray() //new[] { "2", "6", "4", "5", "3" }
);
Line.Save(Server.MapPath("~/Scripts/Line.png"), "PNG");
Image5.ImageUrl = "~/Scripts/Line.png";
var Stock = new Chart(width: 300, height: 300, theme: Blue).AddLegend().SetXAxis("months").SetYAxis("Resource")
.AddTitle("Resource Utilization in Projects in Week 1").AddSeries(name: "cpecial Like", chartType: "Stock",//markerStep: 5, xField: "reeee",
xValue: objcountry.Select(x => x.months).ToArray(), //new[] { "Peter", "Andrew", "Julie", "Mary", "Dave" },
yValues: objcountry.Select(x => x.count).ToArray() //new[] { "2", "6", "4", "5", "3" }
);
Stock.Save(Server.MapPath("~/Scripts/Stock.png"), "PNG");
var myChart1 = new Chart(width: 300, height: 300, theme: myTheme).AddTitle("Resource Utilization in Projects in Week 1")
.AddSeries(name: "Project1", chartType: "StackedColumn", xValue: new[] { "W1", "W2", "W3", "W4", "W5" }, yValues: new[] { 80, 60, 40, 20, 10 })
.AddSeries(name: "Project2", chartType: "StackedColumn", xValue: new[] { "W1", "W2", "W3", "W4", "W5" }, yValues: new[] { 10, 10, 0, 10, 10 })
.AddSeries(name: "Available", chartType: "StackedColumn", xValue: new[] { "W1", "W2", "W3", "W4", "W5" }, yValues: new[] { "10", "30", "50", "70", "80" })
.AddLegend();
myChart1.Save(Server.MapPath("~/Scripts/Stock1.png"), "PNG");
Image7.ImageUrl = "~/Scripts/Stock1.png";
}
public List<ChartData> GetCountryList()
{
List<ChartData> objcountrty = new List<ChartData>();
objcountrty.Add(new ChartData { months = "jan", count = "10" });
objcountrty.Add(new ChartData { months = "feb", count = "40" });
objcountrty.Add(new ChartData { months = "mar", count = "25" });
objcountrty.Add(new ChartData { months = "apr", count = "25" });
objcountrty.Add(new ChartData { months = "may", count = "10" });
objcountrty.Add(new ChartData { months = "jun", count = "40" });
objcountrty.Add(new ChartData { months = "jul", count = "25" });
objcountrty.Add(new ChartData { months = "aug", count = "25" });
objcountrty.Add(new ChartData { months = "sep", count = "10" });
objcountrty.Add(new ChartData { months = "oct", count = "40" });
objcountrty.Add(new ChartData { months = "nov", count = "25" });
objcountrty.Add(new ChartData { months = "dec", count = "25" });
//objcountrty.Add(new ChartData { months = 4, count = "Bengaluru" });
//objcountrty.Add(new ChartData { months = 5, count = "Delhi" });
return objcountrty;
}
public class ChartData
{
public string months { get; set; }
public string count { get; set; }
}
Step3: you can add the default theme for the graph or you can create your custome 3D theme as well.
you can use the default properties as theme: ChartTheme.Green or you can create the your own theme s below and use it as "theme :myThemename ".
public const string myThemename =
@"<Chart BackColor=""#C9DC87"" BackGradientStyle=""TopBottom"" BorderColor=""181, 64, 1"" BorderWidth=""2"" BorderlineDashStyle=""Solid"" Palette=""BrightPastel"">
<ChartAreas>
<ChartArea Name=""Default"" _Template_=""All"" BackColor=""Transparent"" BackSecondaryColor=""White"" BorderColor=""64, 64, 64, 64"" BorderDashStyle=""Solid"" ShadowColor=""Transparent"">
<AxisY LineColor=""64, 64, 64, 64"">
<MajorGrid Interval=""Auto"" LineColor=""64, 64, 64, 64"" />
<LabelStyle Font=""Trebuchet MS, 8.25pt, style=Bold"" />
</AxisY>
<AxisX LineColor=""64, 64, 64, 64"">
<MajorGrid LineColor=""64, 64, 64, 64"" />
<LabelStyle Font=""Trebuchet MS, 8.25pt, style=Bold"" />
</AxisX>
<Area3DStyle LightStyle=""Simplistic"" Enable3D=""True"" Inclination=""30"" IsClustered=""False"" IsRightAngleAxes=""False"" Perspective=""10"" Rotation=""-30"" WallWidth=""0"" />
</ChartArea>
</ChartAreas>
<Legends>
<Legend _Template_=""All"" Alignment=""Center"" BackColor=""Transparent"" Docking=""Bottom"" Font=""Trebuchet MS, 8.25pt, style=Bold"" IsTextAutoFit =""True"" LegendStyle=""Row"">
</Legend>
</Legends>
<BorderSkin SkinStyle=""Emboss"" />
</Chart>";
public const string Blue =
@"<Chart BackColor=""#D3DFF0"" BackGradientStyle=""TopBottom"" BorderColor=""26, 59, 105"" BorderlineDashStyle=""Solid"" BorderWidth=""2"" Palette=""BrightPastel"">
<ChartAreas>
<ChartArea Name=""Default"" _Template_=""All"" BackColor=""Transparent"" BackSecondaryColor=""White"" BorderColor=""64, 64, 64, 64"" BorderDashStyle=""Solid"" ShadowColor=""Transparent"">
<AxisY LineColor=""64, 64, 64, 64"">
<MajorGrid Interval=""Auto"" LineColor=""64, 64, 64, 64"" />
<LabelStyle Font=""Trebuchet MS, 8.25pt, style=Bold"" />
</AxisY>
<AxisX LineColor=""64, 64, 64, 64"">
<MajorGrid LineColor=""64, 64, 64, 64"" />
<LabelStyle Font=""Trebuchet MS, 8.25pt, style=Bold"" />
</AxisX>
<Area3DStyle LightStyle=""Simplistic"" Enable3D=""True"" Inclination=""30"" IsClustered=""False"" IsRightAngleAxes=""False"" Perspective=""10"" Rotation=""-25"" WallWidth=""0"" />
</ChartArea>
</ChartAreas>
<Legends>
<Legend _Template_=""All"" Alignment=""Center"" BackColor=""Transparent"" Docking=""Bottom"" Font=""Trebuchet MS, 8.25pt, style=Bold"" IsTextAutoFit =""True"" LegendStyle=""Row"">
</Legend>
</Legends>
<BorderSkin SkinStyle=""Emboss"" />
</Chart>";
public const string Red = @"<Chart BackColor=""#58A5CB"" BackGradientStyle=""TopBottom"" BackSecondaryColor=""White"" BorderColor=""26, 59, 105"" BorderlineDashStyle=""Solid"" BorderWidth=""2"" Palette=""None"" PaletteCustomColors=""Red"">
<ChartAreas>
<ChartArea Name=""Default"" _Template_=""All"" BackColor=""64, 165, 191, 228"" BackGradientStyle=""TopBottom"" BackSecondaryColor=""White"" BorderColor=""64, 64, 64, 64"" BorderDashStyle=""Solid"" ShadowColor=""Transparent"" />
</ChartAreas>
<Legends>
<Legend _Template_=""All"" BackColor=""Transparent"" Font=""Trebuchet MS, 8.25pt, style=Bold"" IsTextAutoFit=""False"" />
</Legends>
<BorderSkin SkinStyle=""Emboss"" /> </Chart>";
step 3:above all the chart is created and saved as image, all we need to show that images to Enduser.
<form id="form1" runat="server">
<div>
<panel id="container">
<h1>3D chart</h1>
<asp:Image ID="Image1" runat="server" />
<asp:Image ID="Image2" runat="server" />
<asp:Image ID="Image3" runat="server" />
<asp:Image ID="Image4" runat="server" />
<asp:Image ID="Image5" runat="server" />
<asp:Image ID="Image6" runat="server" />
<asp:Image ID="Image7" runat="server" />
</panel>
</div>
</form>
-----------------------------------------------------------------------------------------------------------
you will get Graph as
Column Chart

Pie Chart

Area Chart

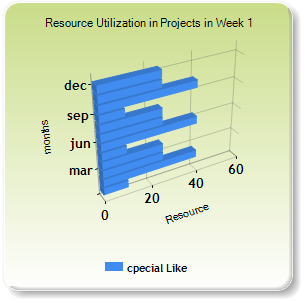
Bar Chart
Stock Chart

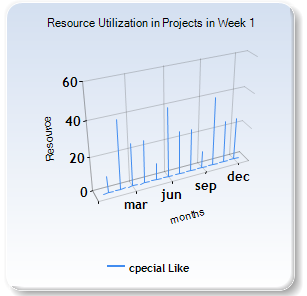
Line Chart
StackedColumn Chart

Click here
How to select columns from Stored Procedure Resultset?
Though Stored Procedure has been introduced many years ago, the question about retrieving columns from Stored Procedure is still very popular with beginners. Let us see the solution in quick steps.
First we will create a sample stored procedure.
CREATE PROCEDURE SampleSPAS
SELECT 1 AS Col1, 2 AS Col2UNION
SELECT 11, 22
GO
Now we will create a table where we will temporarily store the result set of stored procedures. We will be using INSERT INTO and EXEC command to retrieve the values and insert into temporary table.
CREATE TABLE #TempTable (Col1 INT, Col2 INT)GOINSERT INTO #TempTableEXEC SampleSP
GO
Next we will retrieve our data from stored procedure.
SELECT *FROM #TempTableGO
Finally we will clean up all the objects which we have created.
DROP TABLE #TempTableDROP PROCEDURE SampleSP
GO
Let me know if you want me to share such back to basic tips.
Subscribe to:
Comments (Atom)